Description
A profiler to measure the performance of your WordPress plugins and themes.
Code Profiler helps you to measure the performance of your plugins and themes at the PHP level and to quickly find any potential problem in your WordPress installation.
You can profile the frontend and backend of WordPress, as well a cron events, a custom URL, send a POST payload, custom cookies and HTTP headers to profile a contact form, a checkout process or an AJAX action among many other possibilities.
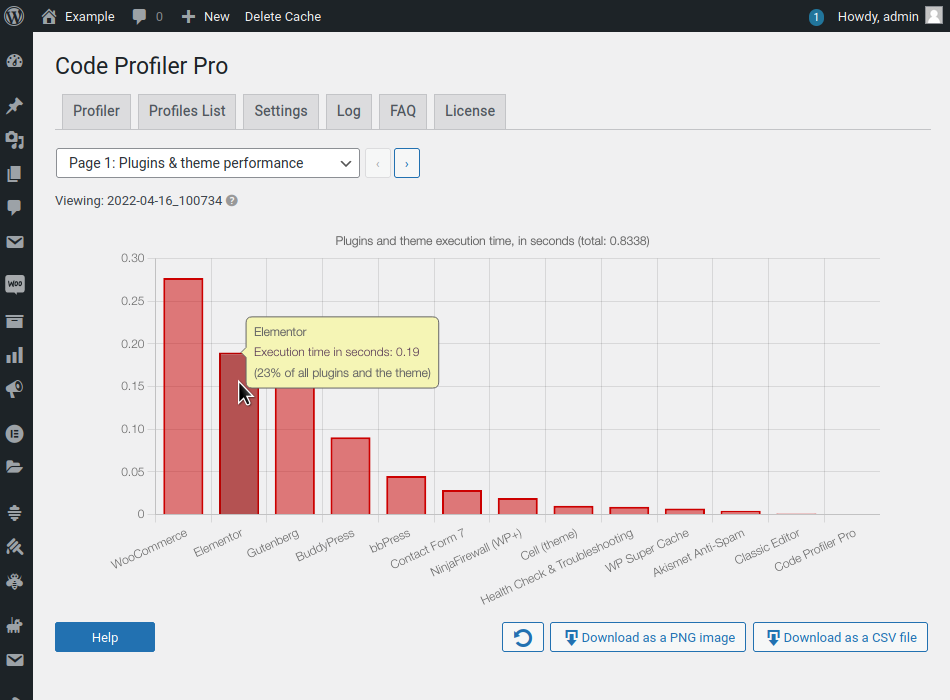
It generates an extremely detailed and easy to read analysis in the form of charts and tables that shows not only which plugin or theme, but also which PHP script, class, method and function is slowing down your website. It displays many useful additional information such as database queries, file I/O operations and disk I/O usage as well.
It makes it very simple to locate any bottleneck problem in your themes or plugins in order to solve it and speed up your website.
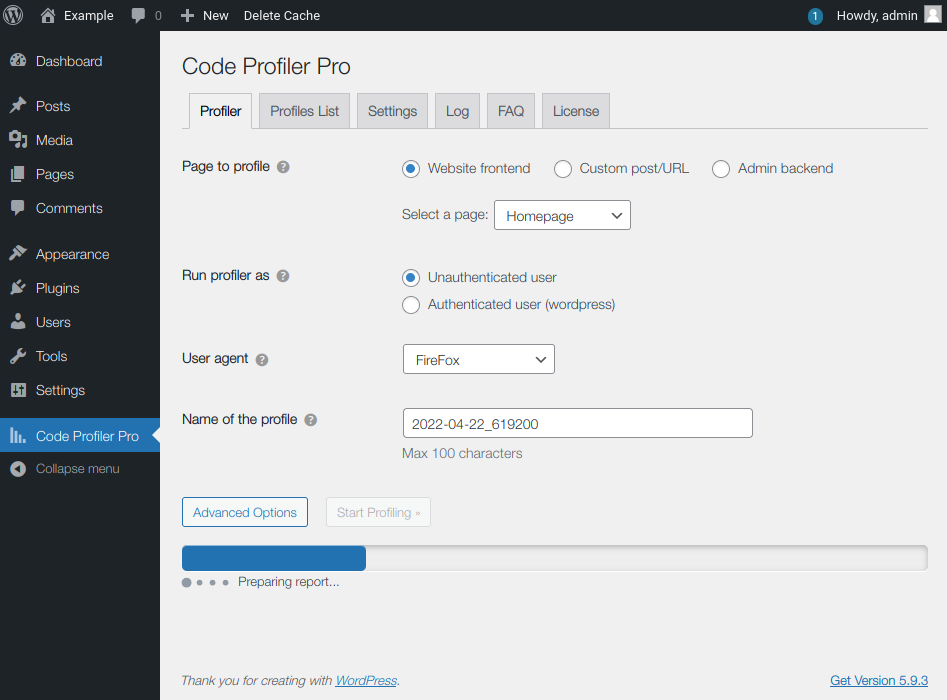
Install, activate it and you can start profiling your site right away.
Features
- Plugins & themes performance profiling.
- [Pro] Scripts performance profiling.
- [Pro] Methods & functions performance profiling.
- [Pro] Database queries performance.
- [Pro] Remote connections monitoring.
- [Pro] File I/O operations monitoring.
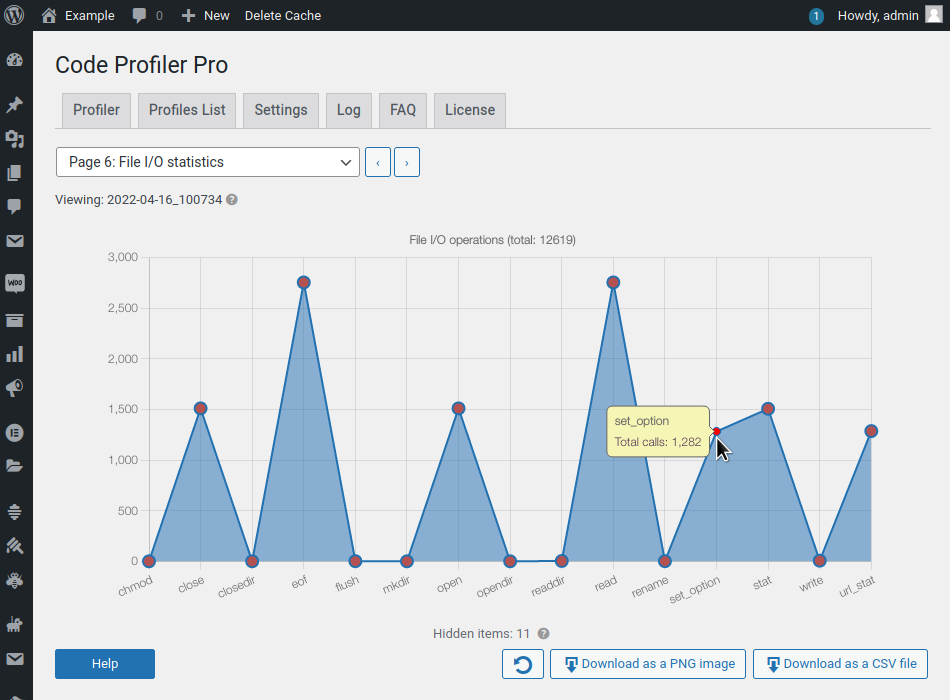
- File I/O statistics.
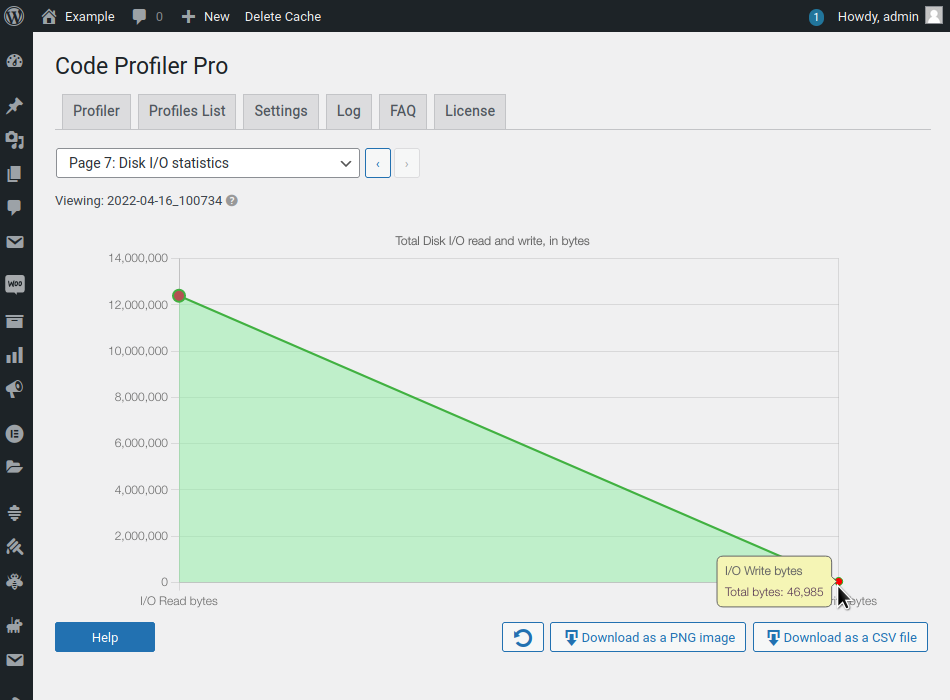
- Disk I/O monitoring.
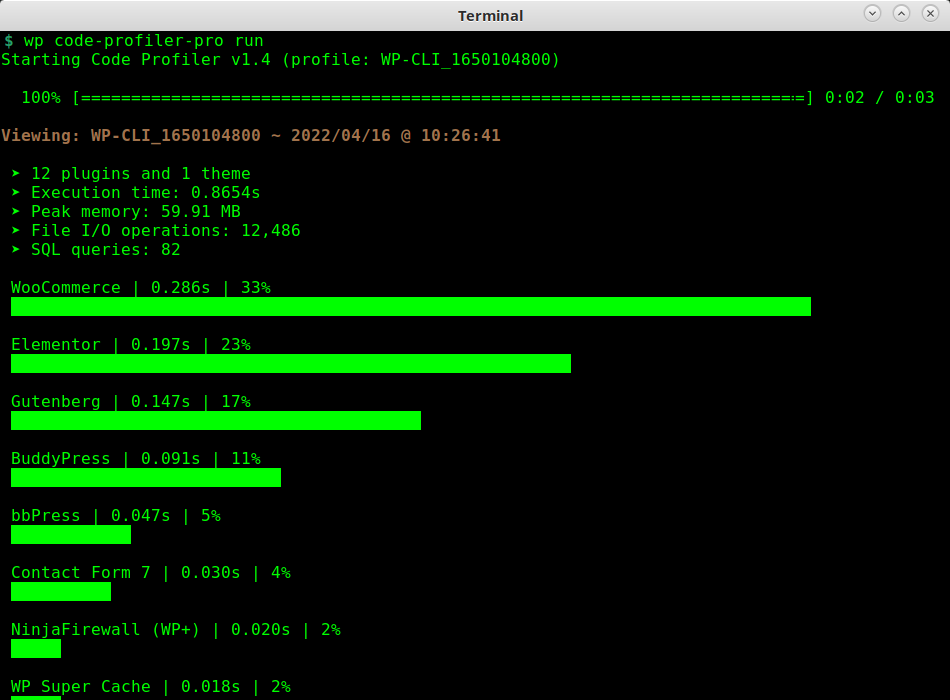
- WP-CLI integration.
- Export charts in PNG image format.
- GET/POST methods, custom cookies and HTTP headers.
- [Pro] Export all tables and charts in CSV file format.
- [Pro] Filtering options
Learn more about Code Profiler Pro.
Screenshots
![[Pro version]: Scripts performance.](https://ps.w.org/code-profiler/assets/screenshot-6.png?rev=2713230)
![[Pro version]: Methods and Functions performance.](https://ps.w.org/code-profiler/assets/screenshot-7.png?rev=2713230)
![[Pro version]: CSV Export.](https://ps.w.org/code-profiler/assets/screenshot-8.png?rev=2713230)
![[Pro version]: CSV Export.](https://ps.w.org/code-profiler/assets/screenshot-9.png?rev=2713230)
![[Pro version]: File I/O List](https://ps.w.org/code-profiler/assets/screenshot-10.png?rev=2713230)
![[Pro version]: Database queries performance.](https://ps.w.org/code-profiler/assets/screenshot-11.png?rev=2713230)
![[Pro version]: Remote connections monitoring.](https://ps.w.org/code-profiler/assets/screenshot-12.png?rev=2902263)
Installation
- Upload the ZIP file from the WordPress “Plugins > Add New” menu.
- Activate the plugin.
- Plugin settings are located in the ‘Code Profiler’ menu.
FAQ
-
What are the differences between Code Profiler and services such as Google PageSpeed or GTmetrix?
-
They are completely different: Code Profiler analyzes the code performance of your plugins and themes on your server, at the PHP level. Google PageSpeed and GTmetrix, instead, analyze the content of a web page from a browser’s perspective.
-
Do I need to deactivate Code Profiler when I’m not using it ?
-
There’s no need to deactivate Code Profiler when you don’t use it, it has no performance impact on your site.
Because an update can affect the performance of your site, you should consider running it after every plugin or theme update. -
Is Code Profiler multisite compatible?
-
Code Profiler is multisite compatible. Note however that for security reasons, only the superadmin can run it.
-
What are the requirements for running Code Profiler?
-
- WordPress >=5.0.
- PHP >=7.1 or 8.x.
-
What is your Privacy Policy?
-
Code Profiler does not collect any private data from you or your visitors. It does not use cookies either. Your website can run Code Profiler and be compliant with the General Data Protection Regulation (GDPR) or other similar privacy laws.
Reviews
Contributors & Developers
“Code Profiler – WordPress Performance Profiling and Debugging Made Easy” is open source software. The following people have contributed to this plugin.
Contributors“Code Profiler – WordPress Performance Profiling and Debugging Made Easy” has been translated into 1 locale. Thank you to the translators for their contributions.
Interested in development?
Browse the code, check out the SVN repository, or subscribe to the development log by RSS.
Changelog
1.9.5 (12 June 2026)
- Fixed a bug where users couldn’t download the grah as a PNG image with the latest version of FireFox (151.0.2+).
1.9.4 (09 June 2026)
- This release includes many small fixes and adjustments to make Code Profiler better (bugs fixed, better error management etc).
1.9.3 (18 May 2026)
- Fixed small UI compatibility issues with WordPress 7.0.
1.9.2 (24 April 2026)
- Removed the warning about composer; it was confusing and has become obsolete.
- Updated the profiler’s browser signatures.
- [Pro version] : Removed a double-slash bug in file paths.
- Fixed a bug where the HTTP response log could be empty.
1.9.1 (19 March 2026)
- Cron events can be profiled with WP-CLI using the
--wpcronparameter.
1.9 (05 February 2026)
- It is now possible to profile cron events: on the profiler main page, click “WP-Cron” and select the cron to profile.
- Updated browser’s signatures.
- Updated Chartjs library.
- Small fixes and adjustments.
1.8.2 (23 December 2025)
- A warning message will be displayed if the Xdebug extension is loaded as it can impact the profiler’s results.
- [Pro version] : Code Profiler will warn if SAVEQUERIES has been disabled by the user.
1.8.1 (09 Octobre 2025)
- When profiling with WP-CLI, the results can be returned in JSON-encoded or CSV format, using the new
--out=<json|csv>parameter. The output can be redirected to a file, e.g.,wp code-profiler run --out=csv > /tmp/results.csv.
1.8 (1st October, 2025)
- This version introduces a new feature requested by many users: the possibility to re-run an existing profile. In the “Profiles List” table, click on the “Re-run” row action link and Code Profiler will run again the profile with the same options and parameters.
- Fixed an “Automatic conversion of false to array is deprecated” message in PHP 8.1+.
- Small fixes and adjustments.
1.7.7 (23 June, 2025)
- Fixed an issue where the profiler wasn’t able to detect if the connection was over HTTPS when running WP CLI.
- Fixed a potential “Function _load_textdomain_just_in_time was called incorrectly” notice when running WP CLI.
1.7.6 (19 June, 2025)
- You can now enter a raw POST payload as opposed to a formatted one, by selecting the “Profiler > Advanced Options > HTTP Method > Content-type > application/x-www-form-urlencoded (raw)” option.
- [Free version] : Fixed a PHP “WP_List_Table::__set(): The property is_empty is not declared” error.
- The “HTTP response log” will show the POST payload (if any) for the last profile.
- Updated ChartJS.
- Small fixes and adjustments.
1.7.5 (06 May, 2025)
- An option to enable PHP error debugging when the profiler is running was added. It is enabled by default and can be turned off in the “Settings” page.
- Updated ChartJS.
- Fixed a few deprecated notices in translation loading, when starting the profiler.
1.7.4 (April 11, 2025)
- Prevent duplicate items in the “File and folder exclusions” list.
- Fixed a PHP 8.4 “fgetcsv(): the $escape parameter must be provided” deprecated notice.
- [Pro version] : Fixed several PHP 8.4 “fputcsv(): the $escape parameter must be provided” deprecated notices.
- Ensure compatibility with the latest WordPress 6.8.
- Updated ChartJS.
1.7.3 (February 15, 2025)
- Updated ChartJS.
- Updated browser’s signatures.
- Truncated exported CSV data to max 32,000 characters per cell to prevent a “maximum numbers of characters per cell was exceeded” error in Libre Office and similar spreadsheet apps.
1.7.2 (November 26, 2024)
- The profiler will now save to a log the HTTP headers and body response of the last profile. It can be useful to debug errors. To view the log, click on the “Logs” tab of the main page.
- Fixed a “Function _load_textdomain_just_in_time was called incorrectly” PHP notice.
- Updated ChartJS.
- Small fixes and adjustments.
1.7.1 (September 27, 2024)
- Fixed a “Security keys do not match” error message that occurred when some object caching plugins were installed on the site. The profiler will no longer temporarily save the key to the database to prevent it from being cached by such plugins.
- Fixed a fatal error when profiling a child site on a multisite installation with WP CLI.
- [Pro version] : Fixed a bug with some row action links in the “Methods and Functions Performance” that were displaying “View function” instead of “View script” when the script was loaded either with the PHP “require” or “include” expression.
1.7 (August 14, 2024)
- The system information report includes now an AJAX API test to make sure the endpoint is accessible to the profiler.
- If the profiler returned a 301/302 HTTP redirection error message, the new location would be written to the log.
- Updated ChartJS.
1.6.10 (May 30, 2024)
- Fixed a bug that affected Microsoft Windows OS only. In some cases, it wasn’t possible to view, delete or rename a profile.
1.6.9 (May 27, 2024)
- You can now exclude files and folders from the profiling process. See “Advanced Options > File and folder exclusions” in the profiler’s main page.
- Fixed a bug where optional HTTP headers could be truncated.
- Replaced all calls to glob() with DirectoryIterator() to make file search compatible with remote files.
- Updated ChartJS.
- Updated browser’s signatures.
1.6.8 (February 14, 2024)
- Fixed an issue in the theme switcher where, in some cases, a child theme could throw an error because the wrong stylesheet was loaded.
- Improved the parsing of the backtrace when attempting to find which plugin or theme initiated a remote connection.
1.6.7 (February 10, 2024)
- If you want to profile different themes, you can now select which theme to load when the profiler is running.
- Updated ChartJS.
1.6.6 (December 6, 2023)
- You can now profile JSON-encoded payloads: In the profiler’s main page, click the “Advanced Options” button, then select “HTTP Method > POST > Content-type > application/json”.
- The Accuracy/precision level is now displayed in the tooltip when viewing a profile.
- Performance and memory optimization.
- [Pro version] : In the “Methods and Functions Performance” section “{main}” is now replaced with the corresponding include/require function (e.g., {include_once} , {require} etc).
- [Pro version] : 2 new columns were added to the “File I/O List”: Status and Resource id. The former will display if the file was closed or not, which could be helpful to detect plugins or themes that open files but don’t close them before exiting, the latter the ID of that resource.
- [Free version]: The directory were the profiler stores its logs can be user-defined, by adding the
CODE_PROFILER_UPLOAD_DIRconstant to your wp-config.php (e.g.,define('CODE_PROFILER_UPLOAD_DIR', '/full/path/to/folder');. - [Pro version]: The directory were the profiler stores its logs can be user-defined, by adding the
CODE_PROFILER_PRO_UPLOAD_DIRconstant to your wp-config.php (e.g.,define('CODE_PROFILER_PRO_UPLOAD_DIR', '/full/path/to/folder');. - Several small fixes and adjustments.
1.6.5 (October 5, 2023)
- Updated Charts.js libraries.
- Fixed potential PHP error when calling number_format function.
- Small fixes and adjustments.
1.6.4 (August 3, 2023)
- Added the possibility to send custom HTTP headers when profiling a site. See “Advanced Options > HTTP headers” in the profiler’s main page.
- Several small fixes and adjustments.
- Updated Charts.js libraries.
1.6.3 (June 18, 2023)
- A new option was added to tweak the size of the memory buffer used by the profiler. It can be found in “Settings > Buffer size”.
- The profiler will disable the PHP display_errors directive so that potential notice, warning and error messages won’t mess up with the AJAX response.
- Small fixes and adjustments.
1.6.2 (May 20, 2023)
- Fixed an issue where the execution time in the “Plugins & Theme Performance” section did not include any occurred remote connection.
- Updated Charts.js libraries.
- Updated FAQ and Help sections.
- Small fixes and adjustments.
1.6.1 (April 22, 2023)
- Added a hook to prevent a timeout if a plugin changed cURL timeout options (props @davidbawiec).
- Several small fixes and adjustments.
1.6 (March 12, 2023)
- [Pro version]: We added a new section: Remote Connections. It shows all HTTP connections originating from your WordPress website and includes the URL, the HTTP status code, the duration and, as usual, a full backtrace.
- Updated browser’s signatures.
- Updated Charts.js libraries.
- Small fixes and adjustments.
1.5.5 (February 24, 2023)
- Improved the system information report.
- [Pro version] : When viewing a file, its name will be displayed in the title bar of the browser.
- The log will be automatically deleted when it reaches 100KB.
- Added a “Debug” checkbox below the log that can be used to increase its verbosity.
- Updated Charts.js libraries.
- Added a warning if the WordPress MU folder is not writable.
- Several small fixes and adjustments.
1.5.4 (January 18, 2023)
- Fixed a potential “404 Not Found” HTTP error when the site home page is different from the WordPress installation directory.
1.5.3 (January 10, 2023)
- It is possible to edit the name of a profile by clicking the “Quick Edit” row action link below its name in the profiles list.
- Updated Charts.js libraries.
- Small fixes and adjustments.
1.5.2 (December 07, 2022)
- Added screen reader accessibility to all 3 graphs (Plugins and Theme, File I/O, Disk I/O).
- The timeout of the profiler’s process was increased from 180 to 300 seconds.
- [Pro version] : Fixed a bug where the file viewer couldn’t locate a function in a script if there was a namespace declared, because it was looking for a method instead of a function.
- Updated Charts.js libraries.
- Small fixes and adjustments.
1.5.1 (October 29, 2022)
- [Pro version] : The profiler can display a full backtrace for each caller function. That option can be enabled in “Settings > Methods & Functions > Generate a PHP backtrace for each caller function”.
- Compatibility with PHP 8.2.
- Improved anonymous functions detection.
- Updated Charts.js libraries.
- [Pro version] : Updated Code Mirror libraries.
- Small fixes and adjustments.
1.5 (September 12, 2022)
- You can select the accuracy and precision level of the profiler. If you have a slow WordPress site with a lot of plugins installed and your server or reverse proxy is timing out when Code Profiler is running, you can lower the accuracy level in order to speed up the profiling process and avoid the server timeout. This option can be found in the “Settings” tab.
- [Free version] : Similarly to the Pro version, the profiler will display a warning below the “Plugins and Themes Performance” chart if it detects that multiple plugins are using Composer dependency manager.
- Added reverse proxy/CDN detection to the system information report.
- Updated Charts.js libraries.
- [Pro version] : Updated Code Mirror libraries.
- Updated the user-agent signatures.
- Small fixes and adjustments.
1.4.4 (July 28, 2022)
- Mu-plugins are now processed by the profiler. They will have the “MU” abbreviation displayed beside their name on all graphs and tables.
- We added a new “Support” tab in the profiler’s page that displays a system information report. When contacting the support for help, please copy and paste it in your ticket.
- [Pro version] : Code Profiler will temporarily disable any “wp-content/db.php” script found on your site to prevent it from interfering with the profiler and database queries. That option can be changed in the “Settings” page.
- Fixed a potential “Serialization of Closure is not allowed” PHP error.
- Small fixes and adjustments.
1.4.3 (July 02, 2022)
- When running the profiler as an authenticated user, you can now enter the name of that user.
- [Pro version] : Fixed a bug in the “File I/O List” section where files located outside the ABSPATH had their name truncated.
- Updated Charts.js libraries.
- [Pro version] : Updated Code Mirror libraries.
- Small fixes and adjustments.
1.4.2 (June 02, 2022)
- The profiler will memorize the settings used for the last profile.
- In the “Profiles List” section, the “Filter” input field will also apply to the profiles name.
- Added Edge browser to the user-agent signatures list box.
- [Pro version] : You can export the list of profiles. Click on the “Download as a CSV file” button below the table in the “Profiles List” section.
- Updated Charts.js libraries.
- [Pro version] : Updated Code Mirror libraries.
- Small fixes and adjustments.
1.4.1 (April 26, 2022)
- Added an “Advanced Options” button in the profiler’s main page that allows you to select the HTTP method (GET or POST), send a POST payload as well as custom cookies. Those features are helpful if, for instance, you want to profile a contact form, a checkout process or an AJAX action etc.
- Small fixes and adjustments.
- [Pro version]: Updated Code Mirror libraries.
1.4 (March 30, 2022)
- [Pro version]: We added a new section: “Database queries performances”. It shows all database queries for the plugins and the theme, their processing time and a backtrace that lists the scripts and function calls that lead to the query.
- [Pro version]: All “Name” columns were renamed to “Component”.
- Fixed an issue in the “Plugins and Theme” graph where special characters were wrongly replaced with their HTML entities.
- WP-CLI: Fixed an issue where all error and warning messages were json-encoded.
- The cURL timeout was increased from 90 to 180 seconds.
- Updated Charts.js libraries.
- [Pro version]: Updated Code Mirror libraries.
- Small fixes and adjustments.
1.3.1 (February 26, 2022)
- Fixed some bugs with right-to-left (RTL) WordPress sites: the tooltip in the profiler main page and the checkboxes below the log were all messed up.
- By default, the profiler will always abort and throw an error if the server didn’t return a “200 OK” HTTP status code. You can change that behaviour in the “Settings” section if the page you are profiling needs to return a different code (3xx, 4xx or 5xx).
- WP-CLI: Added support for HTTP basic authentication with the
--uand--pparameters. Runwp code-profiler helpfor more details. - WP-CLI: Added support for WordPress user authentication with the
--userparameter. Runwp code-profiler helpfor more details. - [Pro version]: WP-CLI: You can now profile any page/post with the
--destparameter. Runwp code-profiler-pro helpfor more details. - When disabling the plugin, it will delete its MU plugin.
- The list of posts has been removed from the dropdown menu. To profile a post, please use the new “Custom post” input field that was introduced in v1.2.
- [Pro version]: Fixed a bug in the “Method & Function” table where the action links were not working on smartphones because of a wrong value used for the colspan attribute.
- [Pro version] : Replaced strcmp() with strnatcmp() to sort some table columns with a “natural order” algorithm.
- You can exclude a plugin during the profiling by using the “Freesoul Deactivate Plugins” plugin available in the WordPress.org repo. See “Is it possible to exclude a plugin during the profiling?” in the “FAQ” section.
- Small fixes and adjustments.
1.3 (February 21, 2022)
- The “Profiles List” table has now 5 new sortable columns that will display several important metrics: “Items” (number of plugins + the current theme), “Time” (execution time in seconds), “Memory” (peak memory in megabytes), “File I/O” (sum of all file I/O operations) and “SQL” (number of database queries). Note that those metrics will be displayed on profiles created with this new version of Code Profiler, not on older profiles. The same metrics can be seen on each profile’s page (click on the tooltip beside the profile’s name) and also when running the profiler from the WP-CLI command line tool.
- [Pro version] : The “Methods & Functions Performance” section now shows all callers of a function. Clicking on the “View Call” action link opens a new row with the list of callers and, for each one, the full path and line number.
- [Pro version] : Fixed a bug in the “File I/O List” section where it was not possible to open a renamed file in the file viewer.
- [Pro version] : It’s possible to enter your license from WP-CLI command line (
wp code-profiler-pro license). - Fixed a bug where temporary files were not deleted after an HTTP error.
- Fixed a bug where the columns sorting order was not remembered after deleting a profile in the “Profiles List” table.
- Small fixes and adjustments.
1.2 (January 30, 2022)
- Added the possibility to profile custom post types and custom URI.
- Added support for HTTP Basic authentication. If you’re running Code Profiler on a staging site that is password protected, the profiler should automatically detect it.
- Added an option to disable WordPress WP-Cron when running the profiler. This option will prevent WP-Cron to run scheduled tasks in the background that could affect the results of the profiler. It is enabled by default.
- Small fixes and adjustments.
1.1.1 (January 12, 2022)
- Fixed a potential error when running the profiler.
1.1 (January 11, 2022)
- Added support for WP-CLI: you can run the profiler from a terminal. Enter
wp code-profiler helpto display the available command line options. WP-CLI integration can be turned on/off in the plugin “Settings” page. - Updated Chart.js library.
- [Pro version]: Updated Codemirror libraries.
- Small fixes and adjustments.
1.0.1 (December 26, 2021)
- Added compatibility with blogs that have permalinks disabled (e.g.,
?page_id=1or?p=1). - Added compatibility with child pages (e.g.,
/foo/bar/). - Added some extra HTTP headers to prevent aggressive caching.
1.0 (December 12, 2021)
- Initial release.